Bitcoin & Debifi Snapshot (May 2026)

May brought a slight pullback for Bitcoin alongside a major milestone for our Bitcoin-backed lending infrastructure.
Closing the month on May 31st, Bitcoin traded at $73,621, marking a modest decrease of roughly -3% from its May 1st opening price of $76,306. The asset's price journey saw early bullish momentum, surging to a monthly peak of $82,850 on May 6th. Despite the downward price action and repeated rejections at resistance, trading volume remained notably stable throughout the month.
Regarding Debifi's lending metrics, the platform reached a historic milestone: for the first time, borrowing costs have dropped into the single digits. The average Annual Percentage Rate (APR) is now at 9.9%, reflecting a highly competitive lending environment. Meanwhile, the average Loan-to-Value (LTV) ratio experienced only minimal changes, remaining rock-solid at 65.45%. We are also observing slightly shorter loan terms, with the average duration decreasing to 13.13 months.
This combination of sub-10% interest rates and stable collateral requirements highlights exceptionally favorable conditions for users looking to unlock liquidity against their Bitcoin holdings without selling.
Sources : Debifi open loan offers, Tradingview & BitBox
May 2026 Overview
May stood out as a month defined by a failed attempt to force a return to the bull market. Throughout the month, we witnessed a classic phenomenon typical of bear market transitions. During these phases, the market experiences a temporary upward consolidation that mimics the start of a true rally.
However, the 200-week moving average proved to be a formidable resistance level. The price tested this strong technical barrier three distinct times (on May 6th, 10th, and 14th) but was rejected on each attempt.
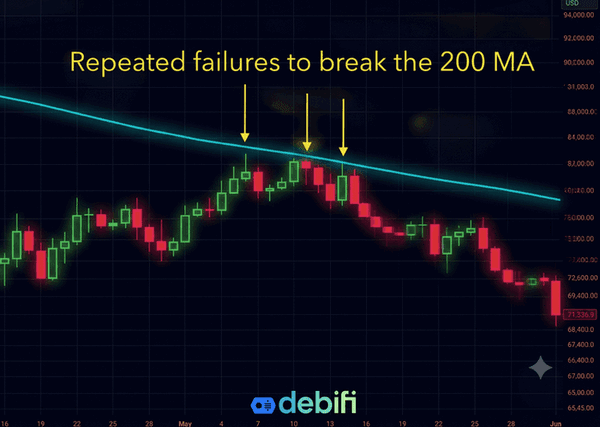
In a market that is still working through structural overhead resistance, these premature surges often fail. This behavior is entirely consistent with historical precedents.
This natural market breather could lead to a temporary return of downside volatility, slightly prolonging our current consolidation phase. Far from being abnormal, this dynamic aligns perfectly with historical market cycles. Given that a standard bear market typically spans 12 to 13 months from its absolute peak to the bottom, the price action of 2026 demonstrates that we seem to follow a very familiar trajectory.
The market is simply taking the necessary time to base, flush out excess leverage, and build a solid foundation before embarking on its next expansionary phase.
In this context of structural rebuilding, the measured collateral management we are currently seeing on the platform proves to be the healthiest and most appropriate strategy. To further refine your risk management strategy and optimize your LTV ratio, please refer to our comprehensive guide.